ARN-361178 · AMFI Registered Mutual Fund Distributor
···
Free Diagnostic · For Existing MF Investors

Free Mutual Fund Portfolio Analyzer

Most investors hold 6–10 mutual funds and assume they're diversified. Often, 40–60% of holdings are the same underlying stocks in different wrappers. Upload your CAS — we'll show you the real picture in under a minute.

No CAS stored
Diagnostic only
ARN-361178

Sample · Overlap Snapshot

Illustrative
47%
weighted overlap across this investor's 7 equity schemes
Top overlapping pairs
Large Cap Fund A Bluechip Fund B
68%
Flexi Cap Fund C Large Cap Fund A
54%
ELSS Fund D Flexi Cap Fund C
41%
Mid Cap Fund E Flexi Cap Fund C
22%
Fund names are illustrative · Not investment advice

What Your Report Reveals

Three diagnostic views of your existing portfolio. Facts, not fund recommendations.

🔁

Scheme Overlap

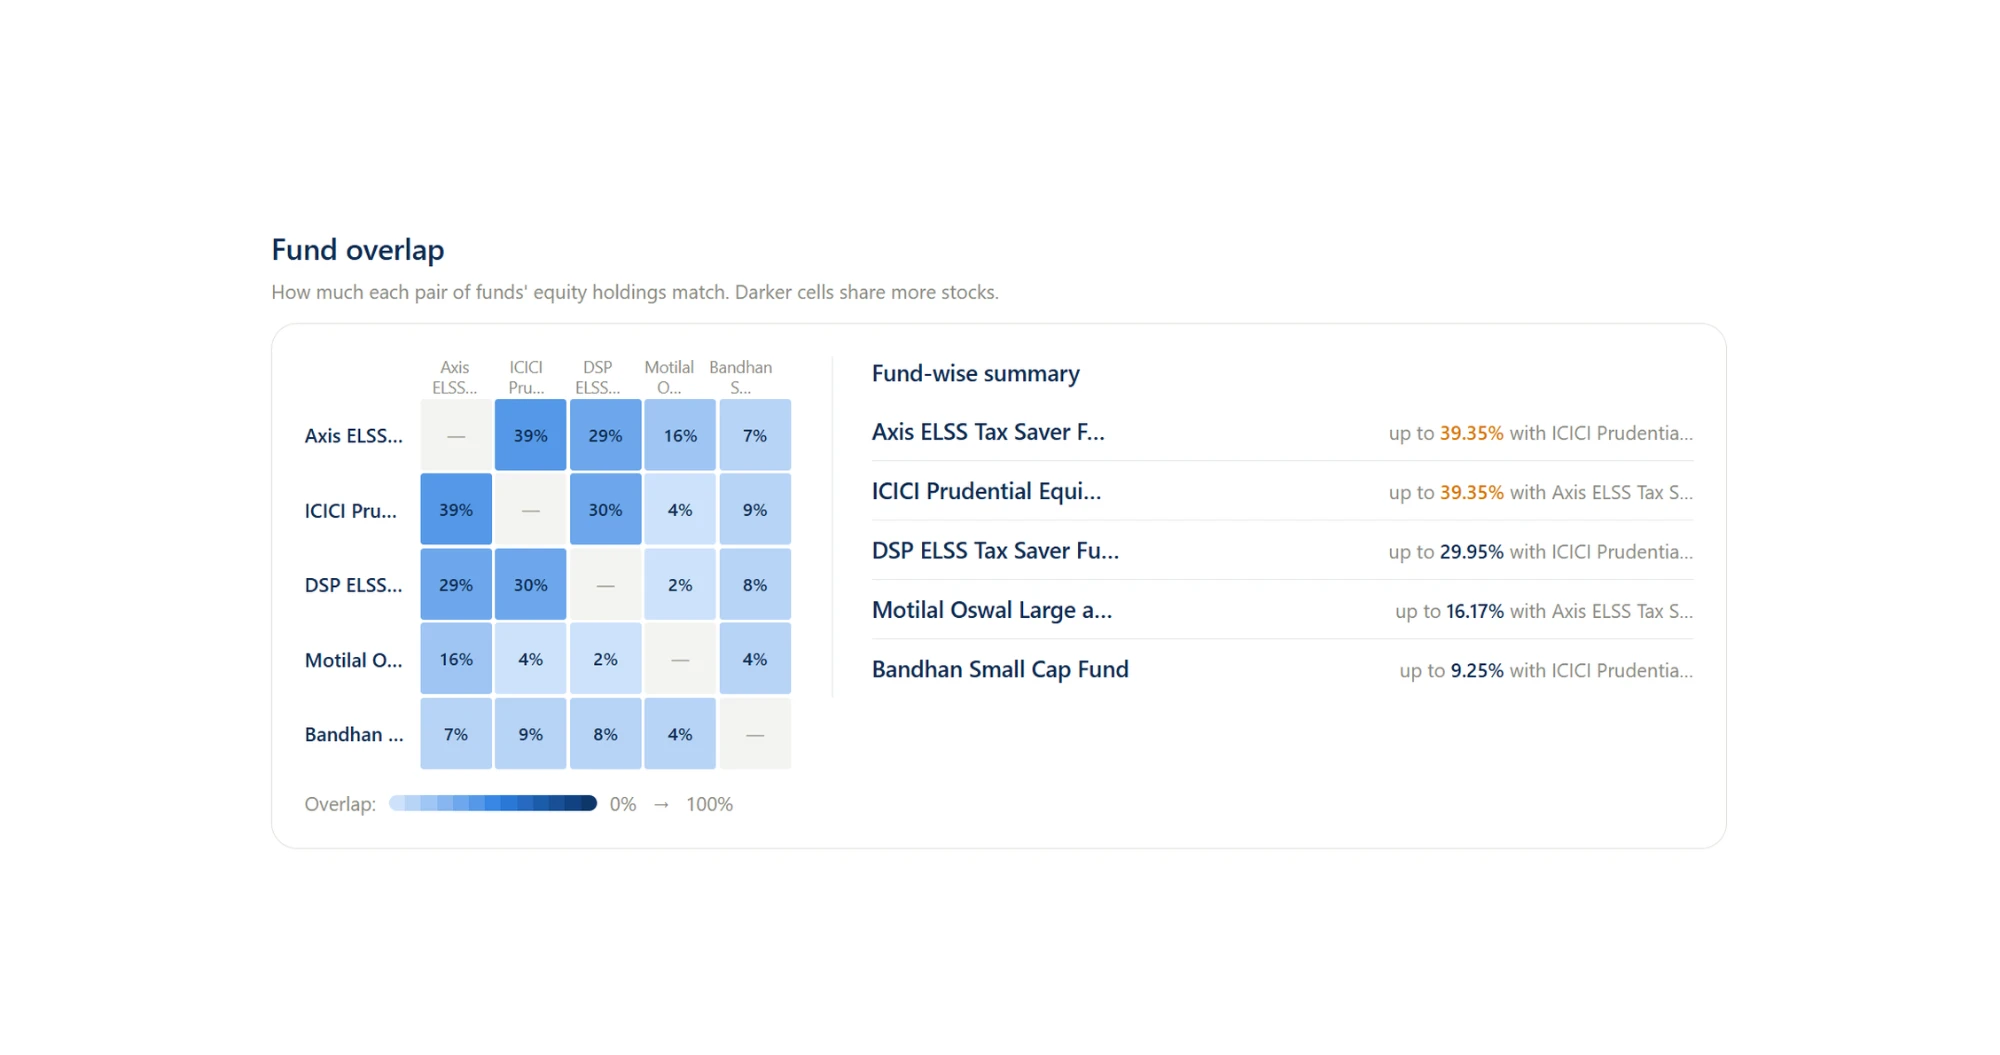
Pair-wise overlap percentages across every scheme you hold — so you can see which funds are doing the same job.

🎯

Concentration Check

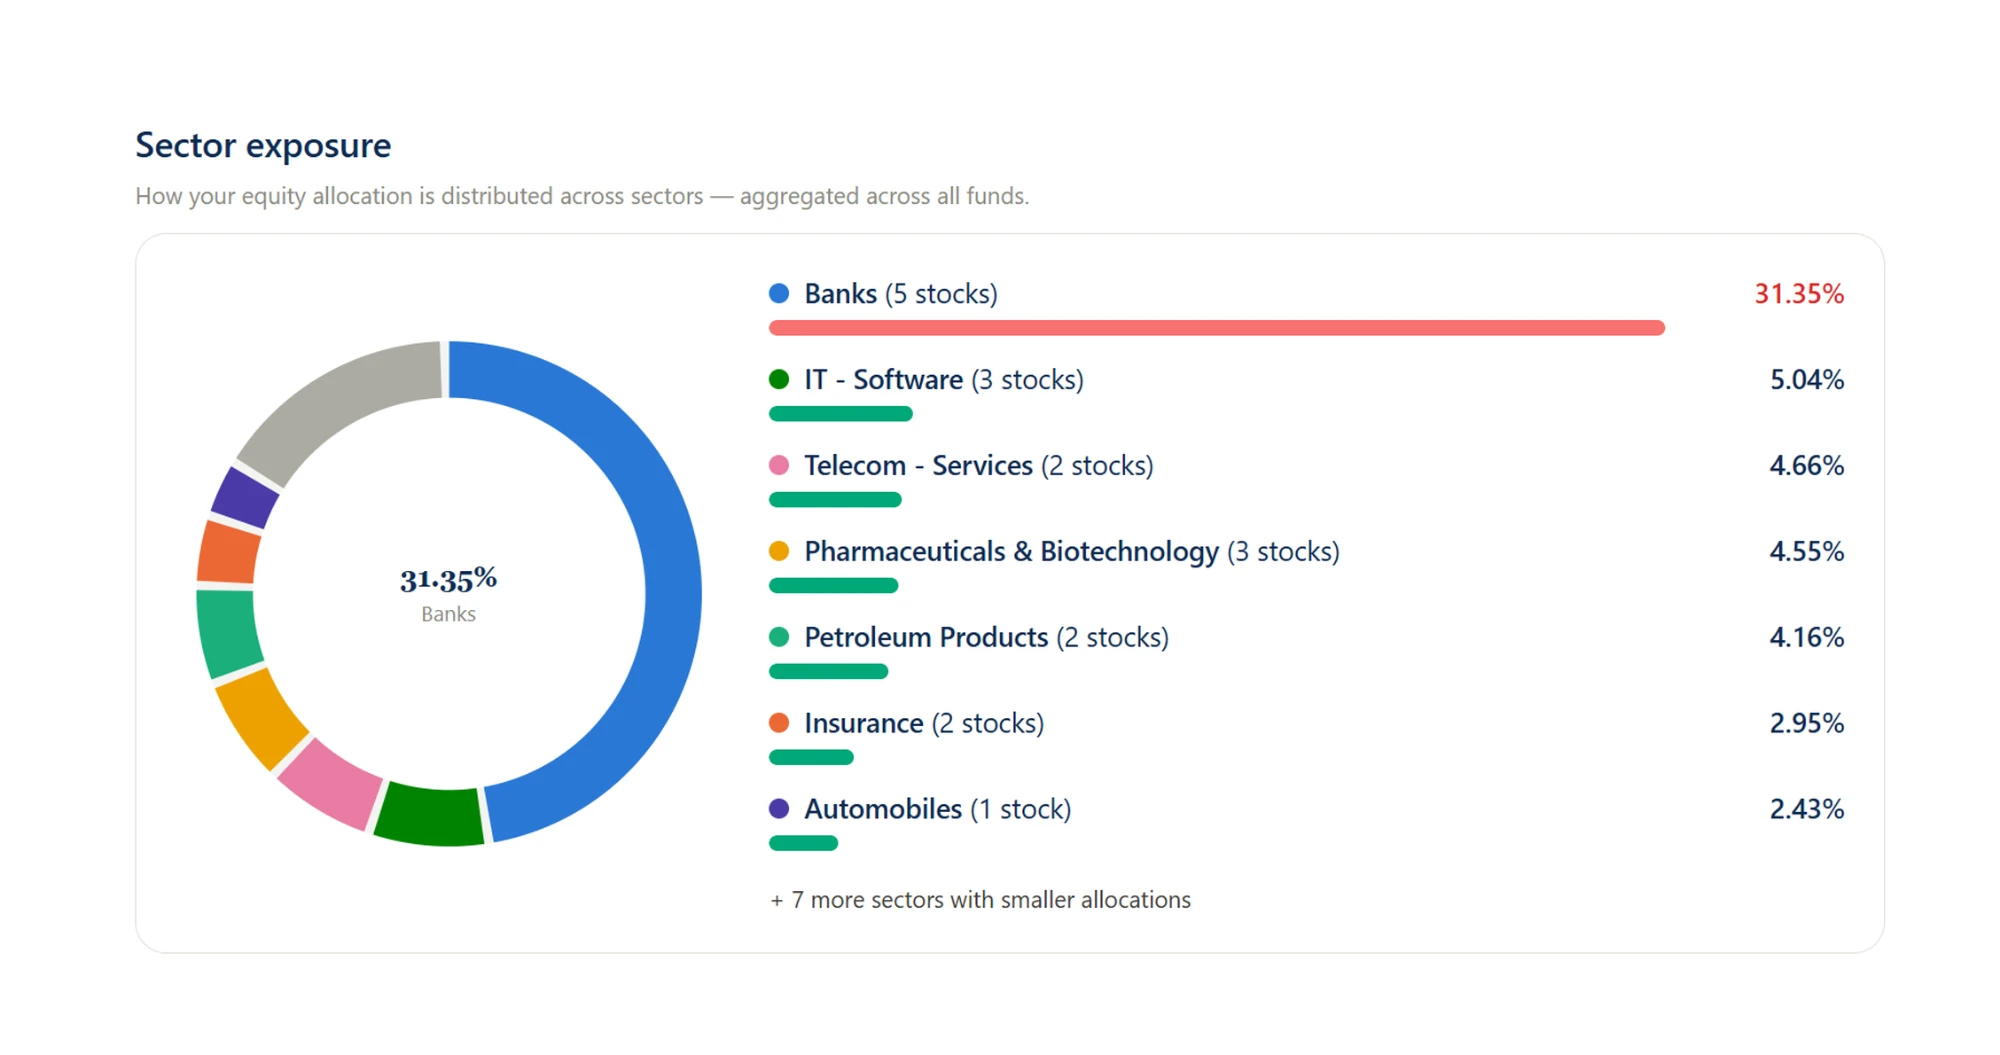
Your top 10 underlying stocks and sector exposures at the look-through level. The real concentration, not the marketing labels.

🧭

Category Allocation

How your money is actually split across Large Cap, Mid Cap, Flexi, ELSS, Debt and others — versus what you assumed.

How It Works

60 seconds end-to-end. No account needed for the diagnostic.

📤STEP 01

Upload Your CAS

Drop in your CAMS or KFintech Consolidated Account Statement (PDF). Don't have one? We'll show you how to request it free in 2 minutes.

⚙️STEP 02

We Look Through

We map every scheme to its latest monthly holdings disclosure, then compute overlap, concentration, and allocation at the stock level.

📋STEP 03

Get Your Report

A clean diagnostic report on screen — and emailed to you if you choose. Facts and figures only. No fund-switch prescriptions.

Why Overlap Quietly Matters

🪞

More funds ≠ more diversification

Two Large Cap funds can share 70%+ of the same Nifty 50 names. Holding both adds cost and complexity, not diversification.

⚖️

Concentration creeps in

When four schemes all hold the same top 10 stocks, your single-stock exposure can quietly cross what you'd consider safe.

🧾

Effort that doesn't pay you

Tracking 8 funds when 4 would do the same job means more KYC, more statements, more capital-gains math at exit — for no extra return.

👁️

You can't fix what you can't see

No major broker shows you look-through overlap by default. This diagnostic is the missing view.

What You'll Receive

A 3-page diagnostic. Numbers, charts, and observations — no fund-switch directives.

Page 1

Overall Health

  • Portfolio value & XIRR
  • Weighted average overlap
  • Effective fund count
Page 2

Overlap Matrix

  • Pair-wise overlap heatmap
  • Top redundant pairs
  • Look-through stock list
Page 3

Concentration

  • Top 10 stocks (% of equity)
  • Sector exposure breakdown
  • Category allocation pie

Your CAS isn't stored

The PDF is parsed in-session and discarded as soon as your report is generated. We do not retain holding-level data.

Diagnostic, not advice

The report describes your portfolio as it is. It does not prescribe fund switches, redemptions, or new purchases.

AMFI-registered transparency

Pankh Technology is an AMFI-registered Mutual Fund Distributor (ARN-361178). We are not a SEBI Investment Adviser.

Frequently Asked

What's a CAS and how do I get one?

+
A Consolidated Account Statement (CAS) lists every mutual fund holding across all AMCs. You can request one free from CAMSonline or KFintech — it arrives by email in a few minutes. We'll walk you through it on the next screen.

Is this really free?

+
Yes. The diagnostic report is free. Pankh earns from AMFI-disclosed distributor commissions only if and when you choose to invest in schemes through us — never from this report.

How fresh is the holdings data?

+
AMCs disclose portfolio holdings monthly. We map your schemes to their latest published holdings (typically 15–45 days old). The report shows the disclosure date for each fund.

Will you tell me which funds to sell?

+
No. This is a diagnostic tool, not a recommendation engine. The report shows you the facts about your portfolio — overlap, concentration, allocation. What you do with that information is your decision, or one to make with a SEBI-registered investment adviser.

Who is this built for?

+
Investors who already hold 4 or more mutual fund schemes and want a clearer view of what they actually own. If you're just starting your MF journey, our Goal Planner is a better starting point.

See What's Really In Your Portfolio

60 seconds. No account. No CAS stored. Just a clean, honest look at the funds you already own.